Risk Graphs
Overview
The Risk Graph is a tool designed for risk modeling, providing a visual representation of potential profit and loss (PnL) scenarios as the underlying asset price fluctuates and options reach maturity. This helps traders assess risk and make informed decisions.
Risk graphs are the primary tool for monitoring positions and used extensively in MesoLive:
- During the build flow when creating a position: Create and Adjust Positions
- In Portfolio monitoring dashboard: Monitor Strategies and Underlyings
- Single position drill-down: Monitor Positions
Video tutorial
Understanding Risk Graphs
This section describes what the risk graph shows and how to interpret it for effective risk management.
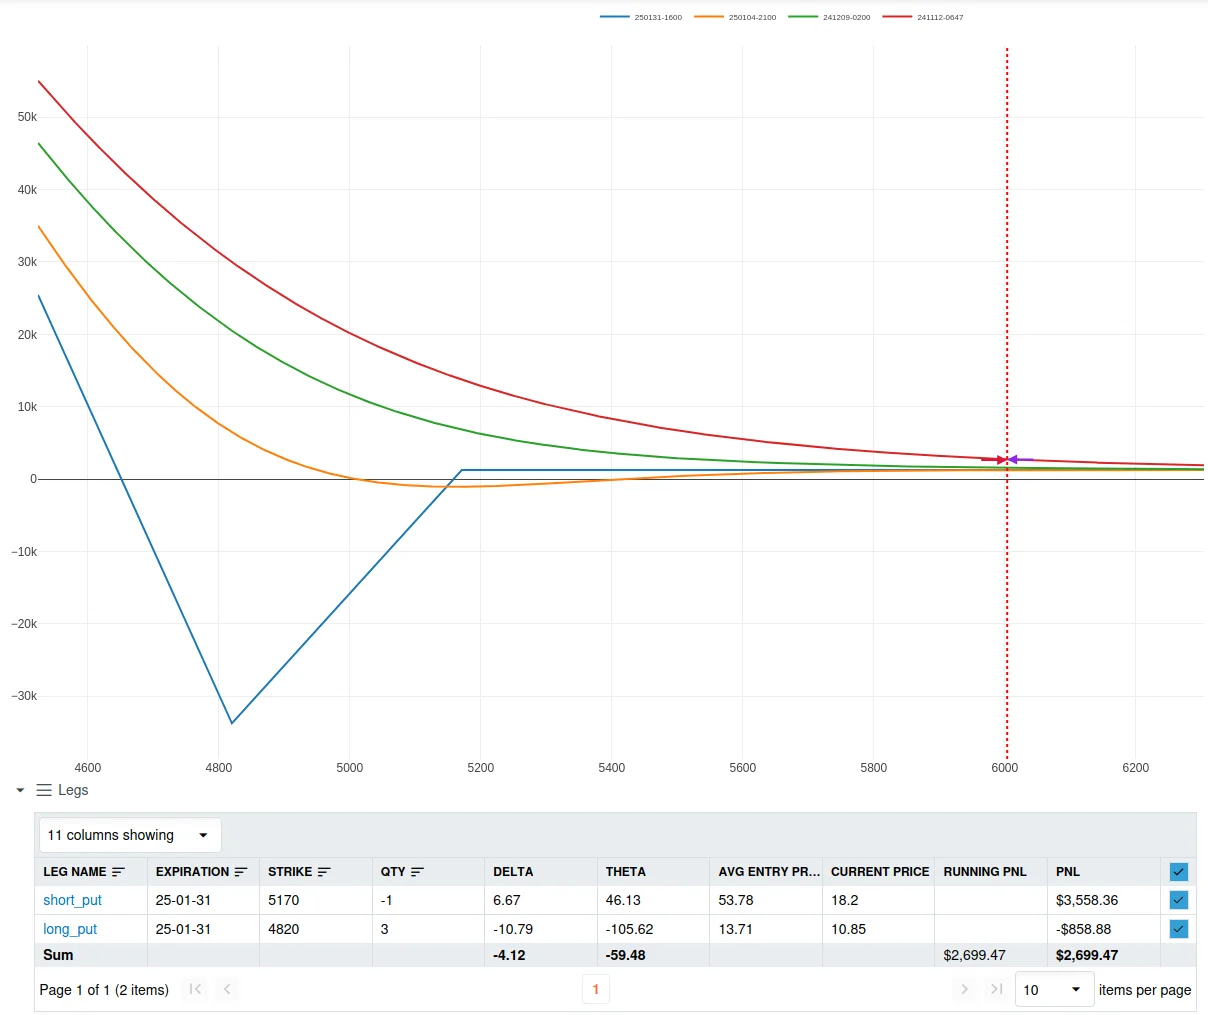
X-axis: Underlying Asset Price
This axis shows the price of the underlying asset. Moving along this axis simulates how different price points will impact the projected PnL.
Y-axis: Projected Profit and Loss
The Y-axis displays projected profit and loss values, helping traders assess potential gains or losses at various asset price points.
T+x Lines: PnL Projections Over Time
Each T+x line represents a different point in time, allowing traders to view how PnL is projected to evolve. These lines help visualize possible outcomes if the option position is closed before expiration.

In the Portal, the risk graph is typically paired with a Legs table that lists all legs and lets you toggle individual legs on/off. For leg-level details and troubleshooting, see Position Tracking → Legs.
Options Valuation Models
For European Options MesoLive (and MesoSim) uses Black Scholes Model for Risk Graph projections. For American Options, a binomial tree model is used.
In both cases, the models use accurate Risk Free Rate and Days Till Expiration inputs.
3D Graphs
Some pages provide a 3d Graphs button that opens an interactive 3D surface view:
- a 3D view for a single position (see Monitor Positions)
- a 3D view for aggregated exposure on an underlying (see Monitor Strategies and Underlyings)
What the 3D view shows
The dialog renders two surfaces:
- PnL surface: projected PnL across a grid of:
- X-axis: underlying price scenarios
- Y-axis: time/expiration (the same “T+x” concept, shown as dates)
- Z-axis: projected PnL
- Greeks surface: the same grid, but the Z-axis is the selected greek (Delta/Gamma/Theta/Vega/WVega).
Markers:
- Cross markers on the PnL surface highlight the current Mark/Mid and Bid/Ask PnL estimate at the current underlying price.
Controls and refresh
- You can rotate/zoom/pan the 3D view to inspect “risk over time” intuitively.
- Use the greek dropdown to switch which greek surface is shown.
- The dialog refreshes periodically (about once per minute). A manual Refresh button is also available.