Today View
The Today page is a calendar-style view of your deployed strategies and positions, designed for day-to-day monitoring.
Video tutorial
Usage
To access the Today view, click on the Today item in the navigation bar.
Use this page to:
- Run your daily “what’s active / what’s coming up” review
- Jump quickly from a calendar item → a position (open/closed) or build flow (upcoming)
- Keep a split view of calendar + market chart on one screen
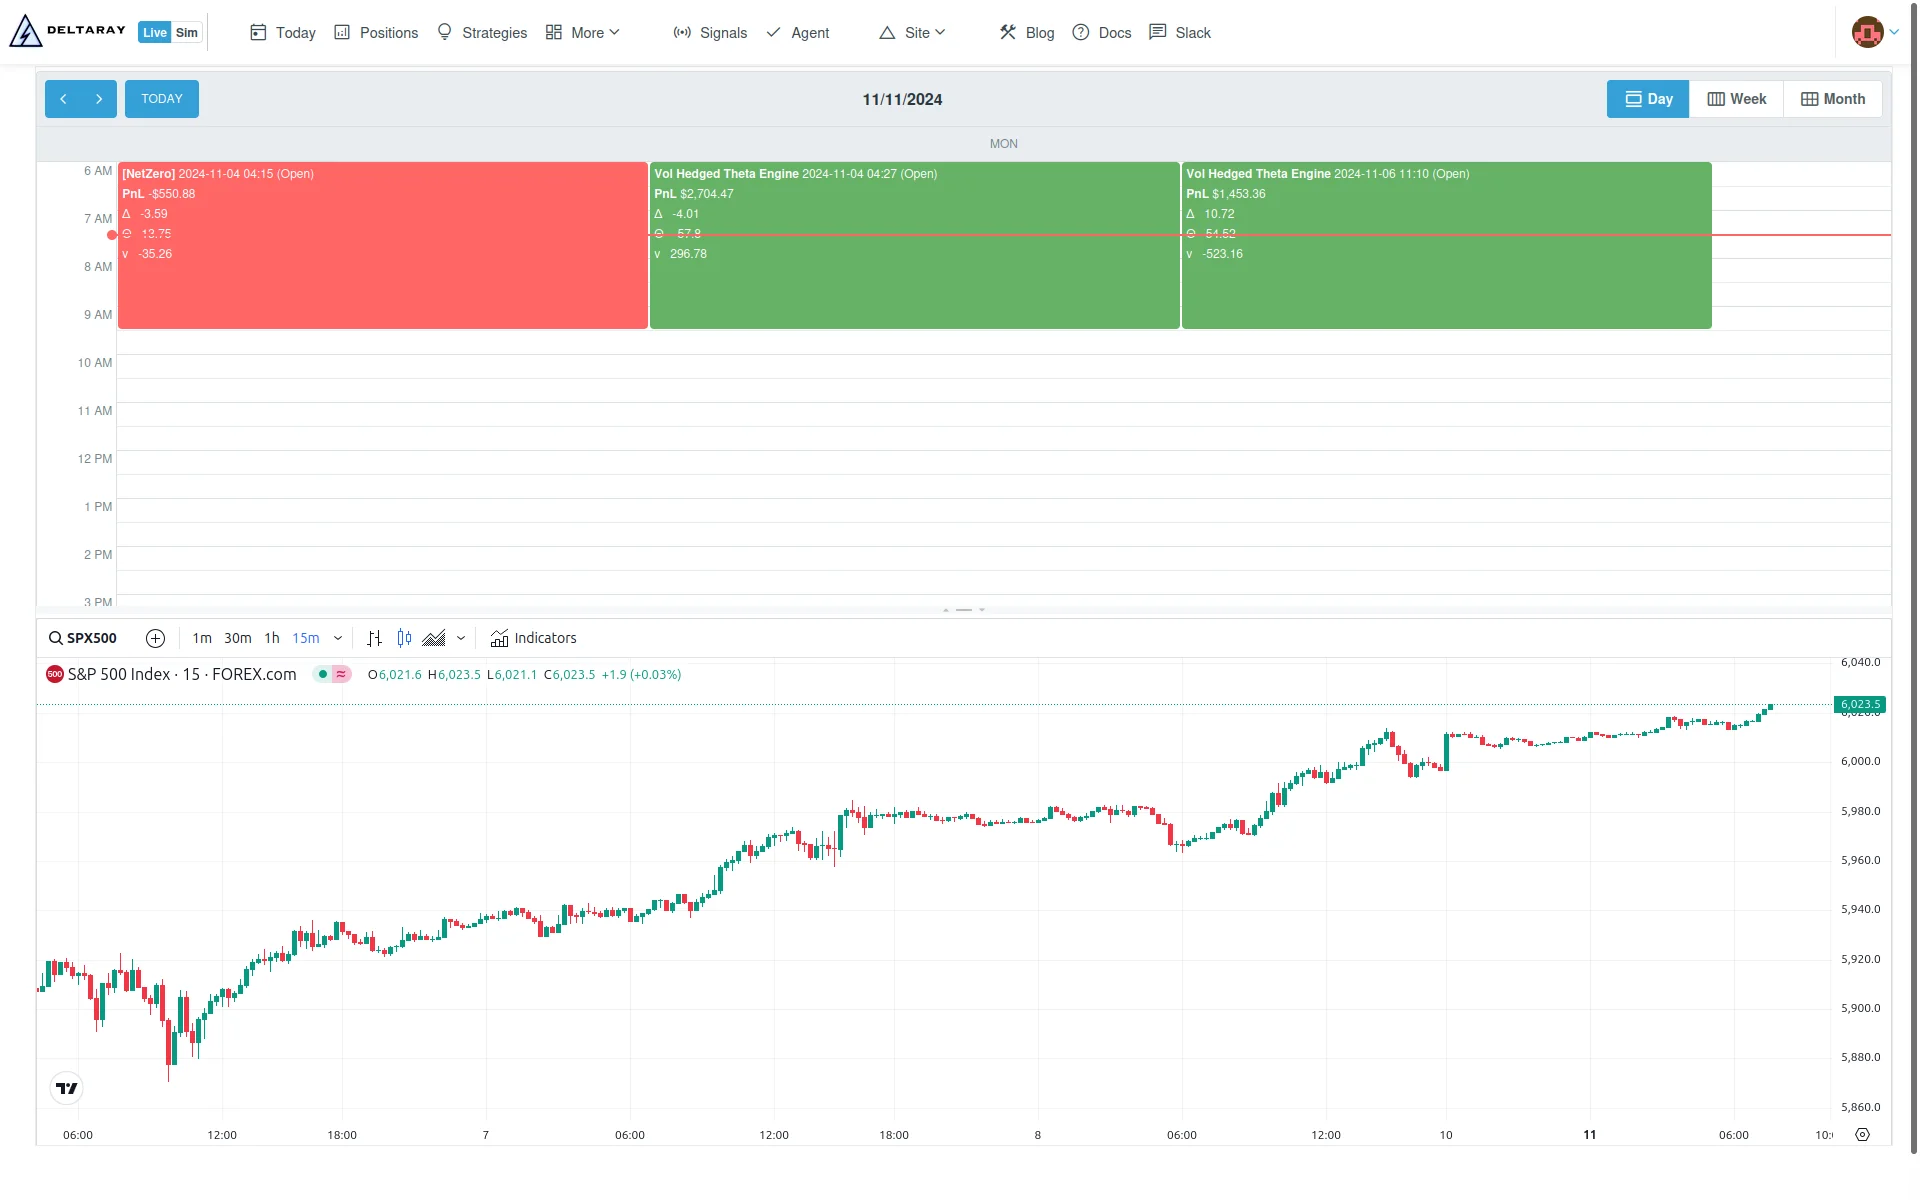
Page layout
The Today page has two panes:
- Top pane: the positions calendar (Day/Week/Month)
- Bottom pane: a TradingView chart widget (defaults to S&P 500)
You can resize the split; the Portal saves the split size in your browser.
Account filtering
If you have multiple accounts, use the Accounts selector to control which accounts are shown in the calendar. This selection is saved in your browser and is also used by other account-filtered dashboards.
Calendar interactions
- Switch between Day / Week / Month views.
- Hover an item to see a tooltip.
- Click an item:
- If the item represents a tracked position, it opens that position (
/positions/{PositionId}). - Otherwise it opens the build flow for that strategy (
/strategies/{StrategyId}/new-position).
- If the item represents a tracked position, it opens that position (
- Hold Ctrl (Windows/Linux) or Cmd (macOS) while clicking to open in a new tab.
Calendar colors
- Open positions:
- Profit: light green
- Loss: light red
- Closed positions:
- Closed in profit: dark green
- Closed in loss: dark red
- Upcoming entry windows (schedule-driven): blue
Timezone and “current time” marker
- Times are shown in US/Eastern (market time).
- The red “current time” marker updates with ~30-minute resolution.
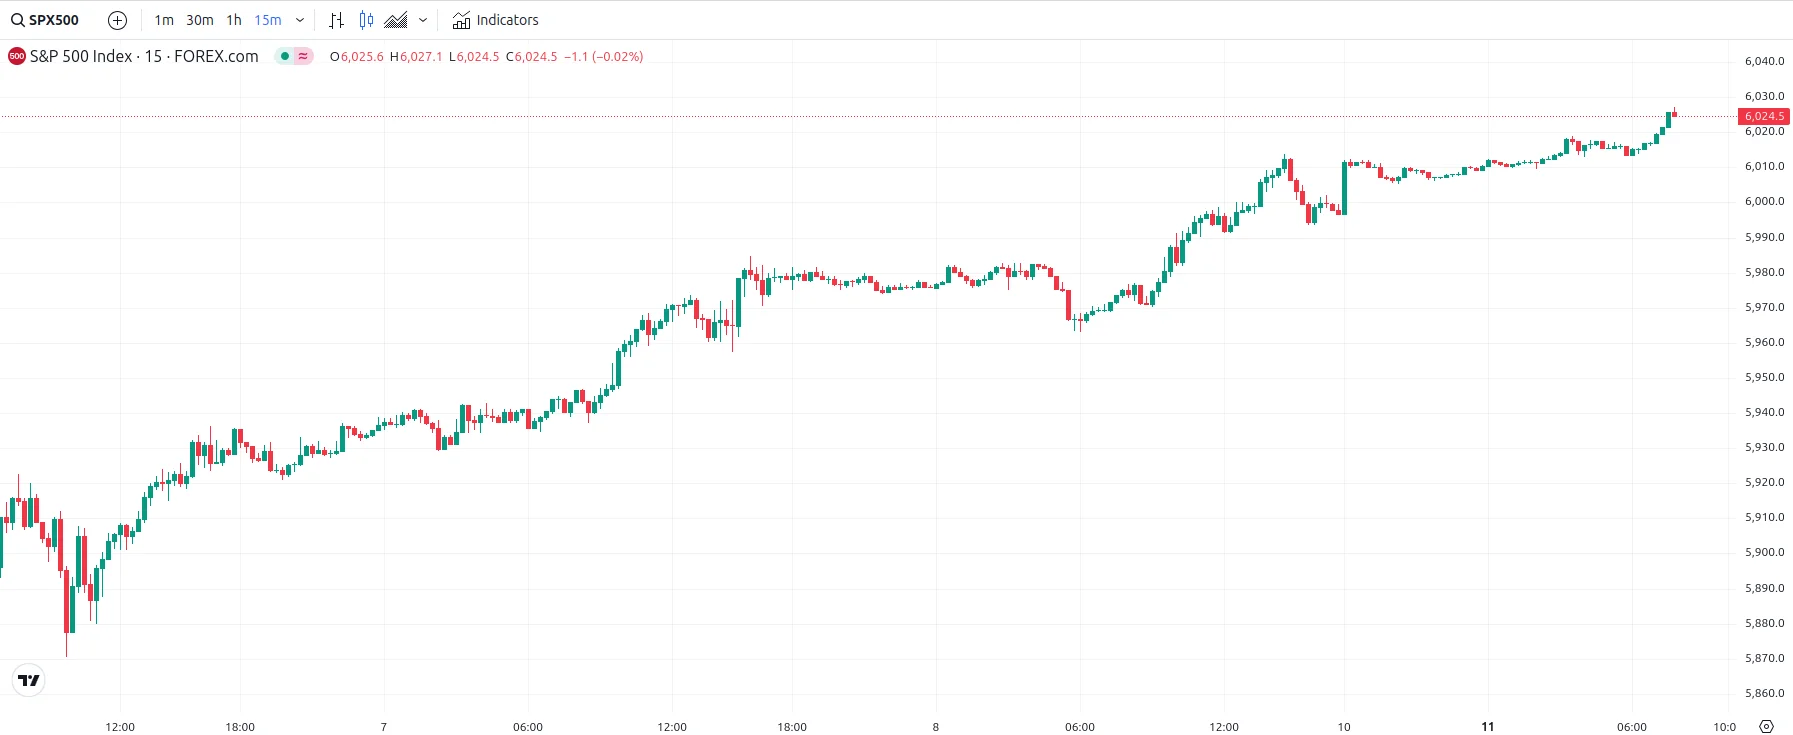
S&P 500 chart
Below the position calendar, you'll find a real-time S&P 500 chart. This chart provides live market updates, helping you make informed decisions for your positions.
Troubleshooting
- Missing items: check the Accounts filter (it persists across sessions).
- Tooltips show errors or greeks look stale: start with Troubleshooting → Agent, then inspect Data Explorer