Monitor Positions
Video tutorial
Positions page
The Positions page is the main monitoring dashboard for open positions with optional slideshow-style cycling.
It contains a toolbar and shows the list of open positions with risk graphs and greeks, along with leg tables for quick inspection of the position structure. The toolbar provides controls for filtering visible positions/accounts, auto-cycling through positions, and assigning unassigned legs.
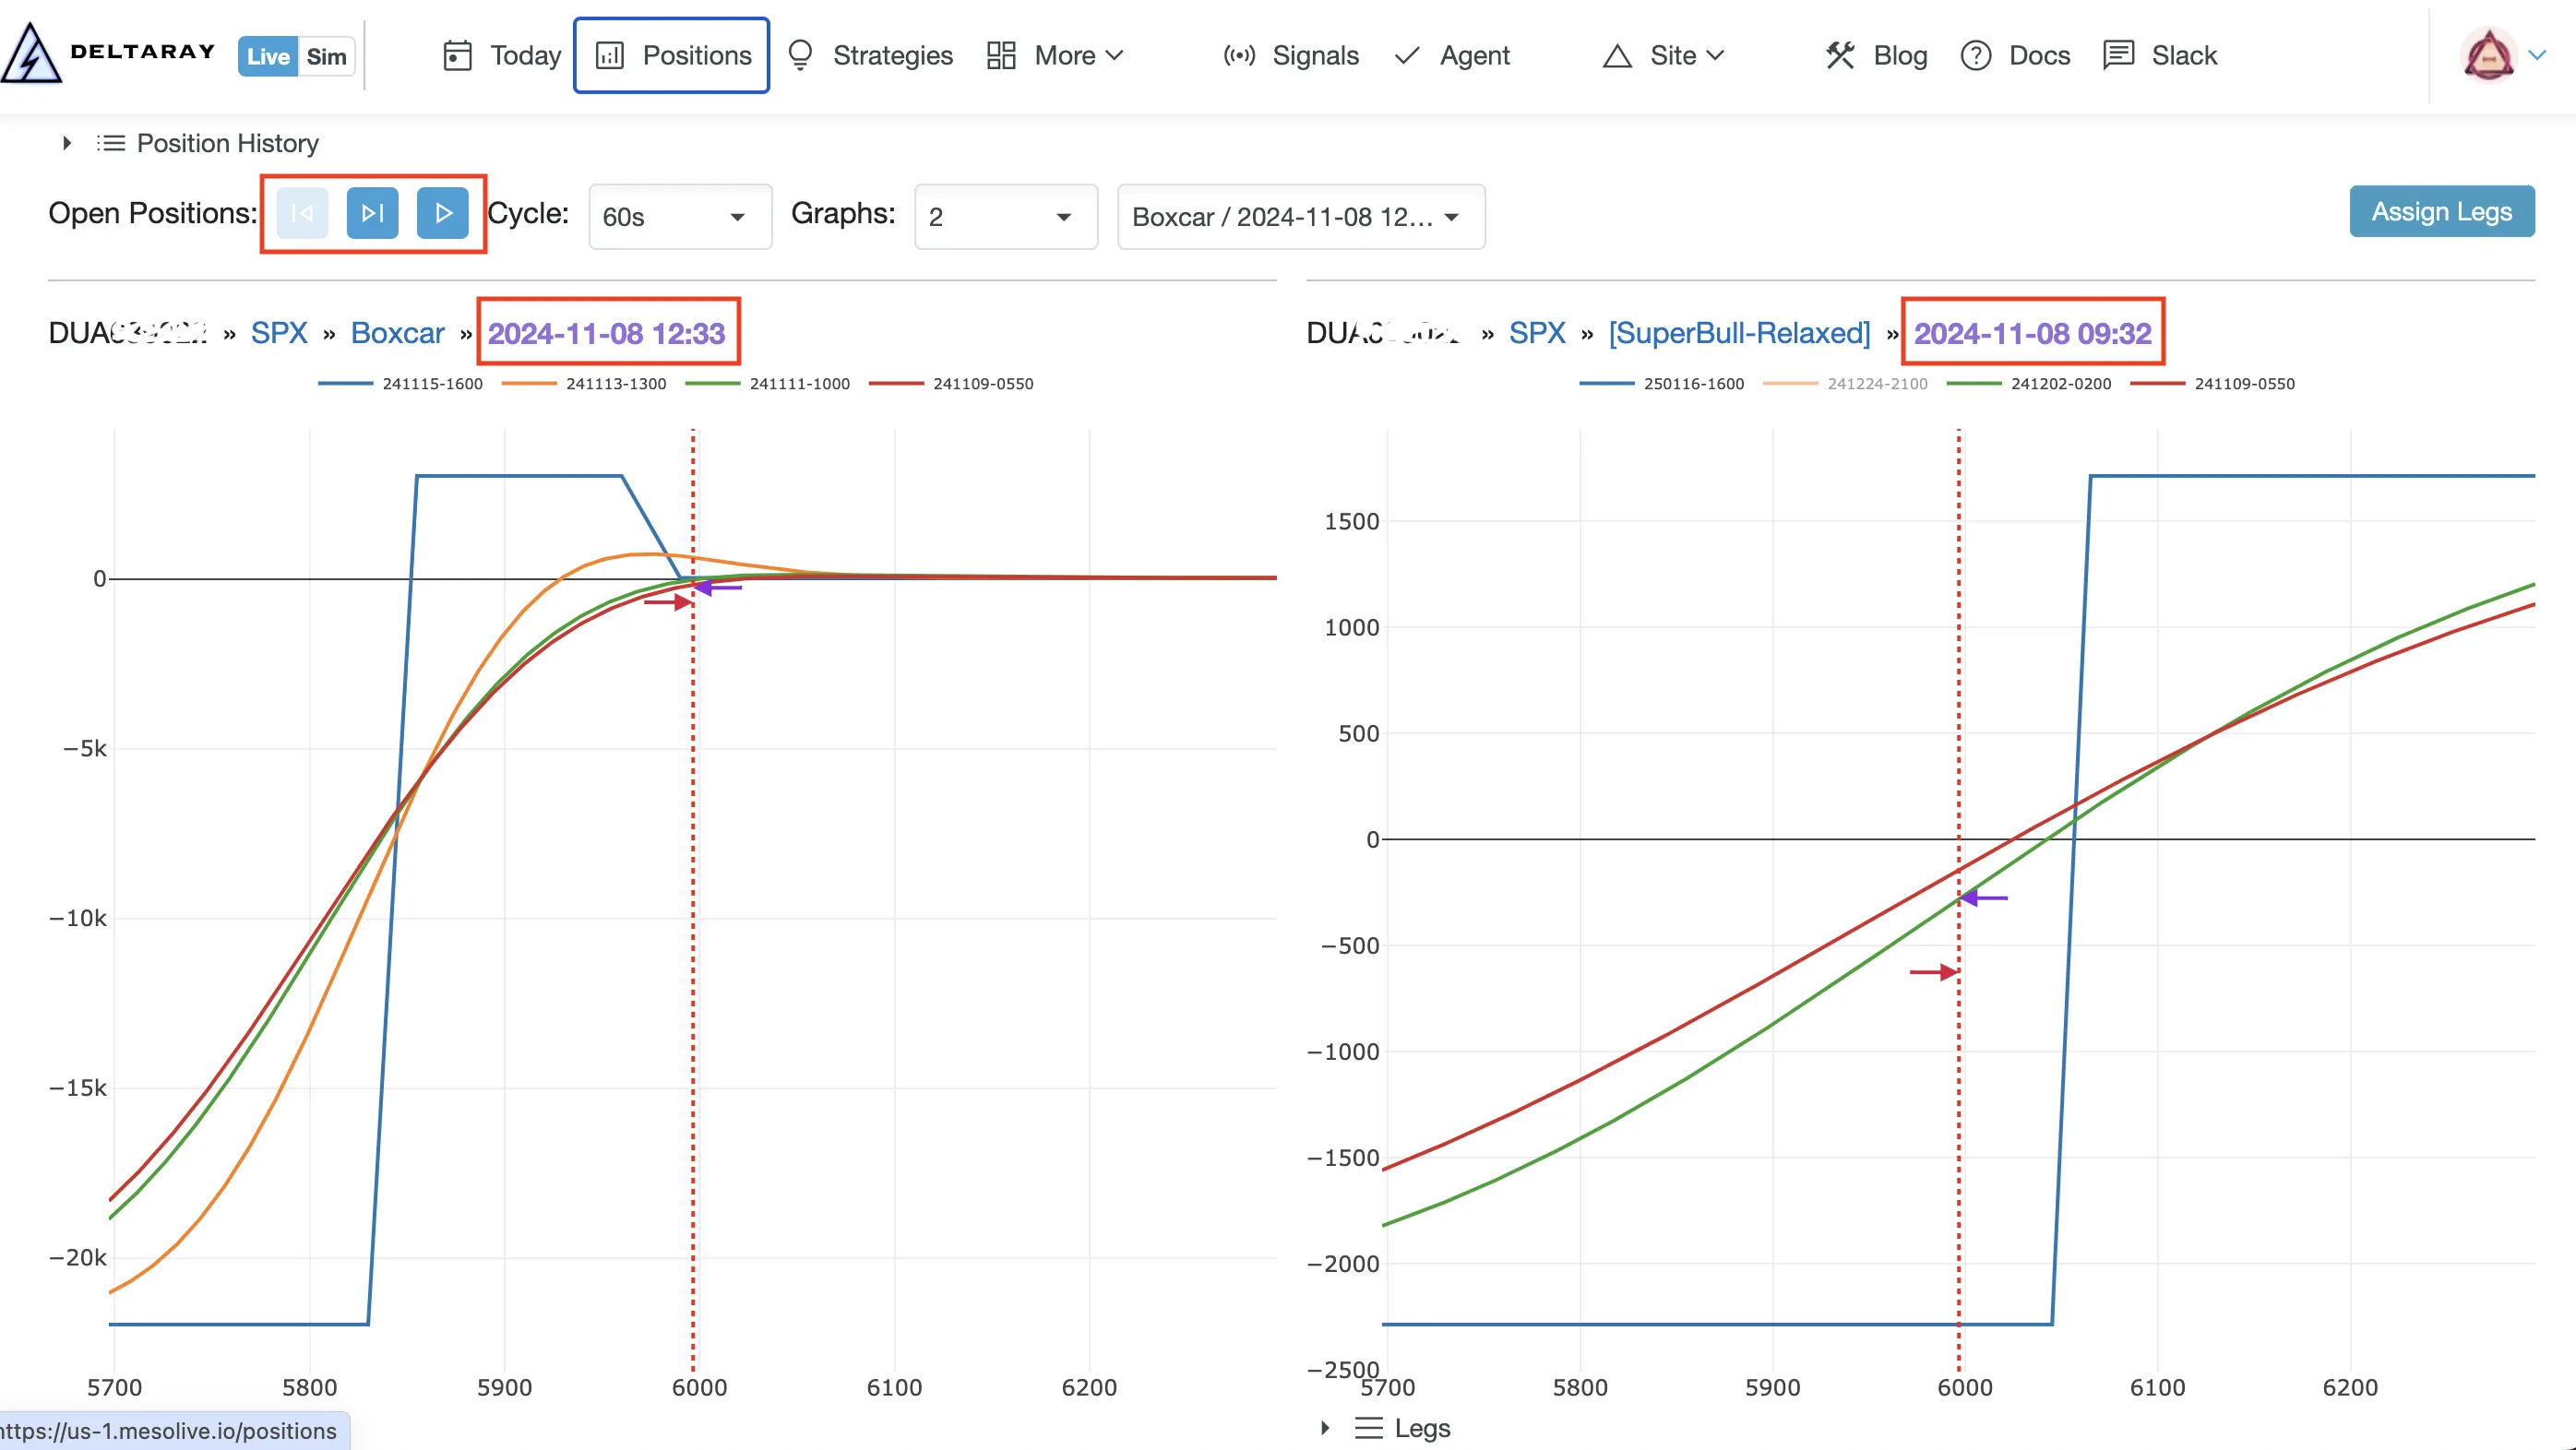
The Positions toolbar
- Previous / Next: page through visible positions (keyboard: left/right arrows)
- Play / Stop + Cycle: auto-cycle for monitoring screens
- Graphs: show 1/2/4 graphs at once
- Visible Positions / Visible Accounts: control what’s included
- Assign Legs : repair tracking when legs are unassigned (see Position Tracking → Legs)
Position Details
The Position Details page is where you monitor a position and act on signals, adjustments, and liquidation.
- URL pattern:
https://mesolive.io/positions/{PositionId}
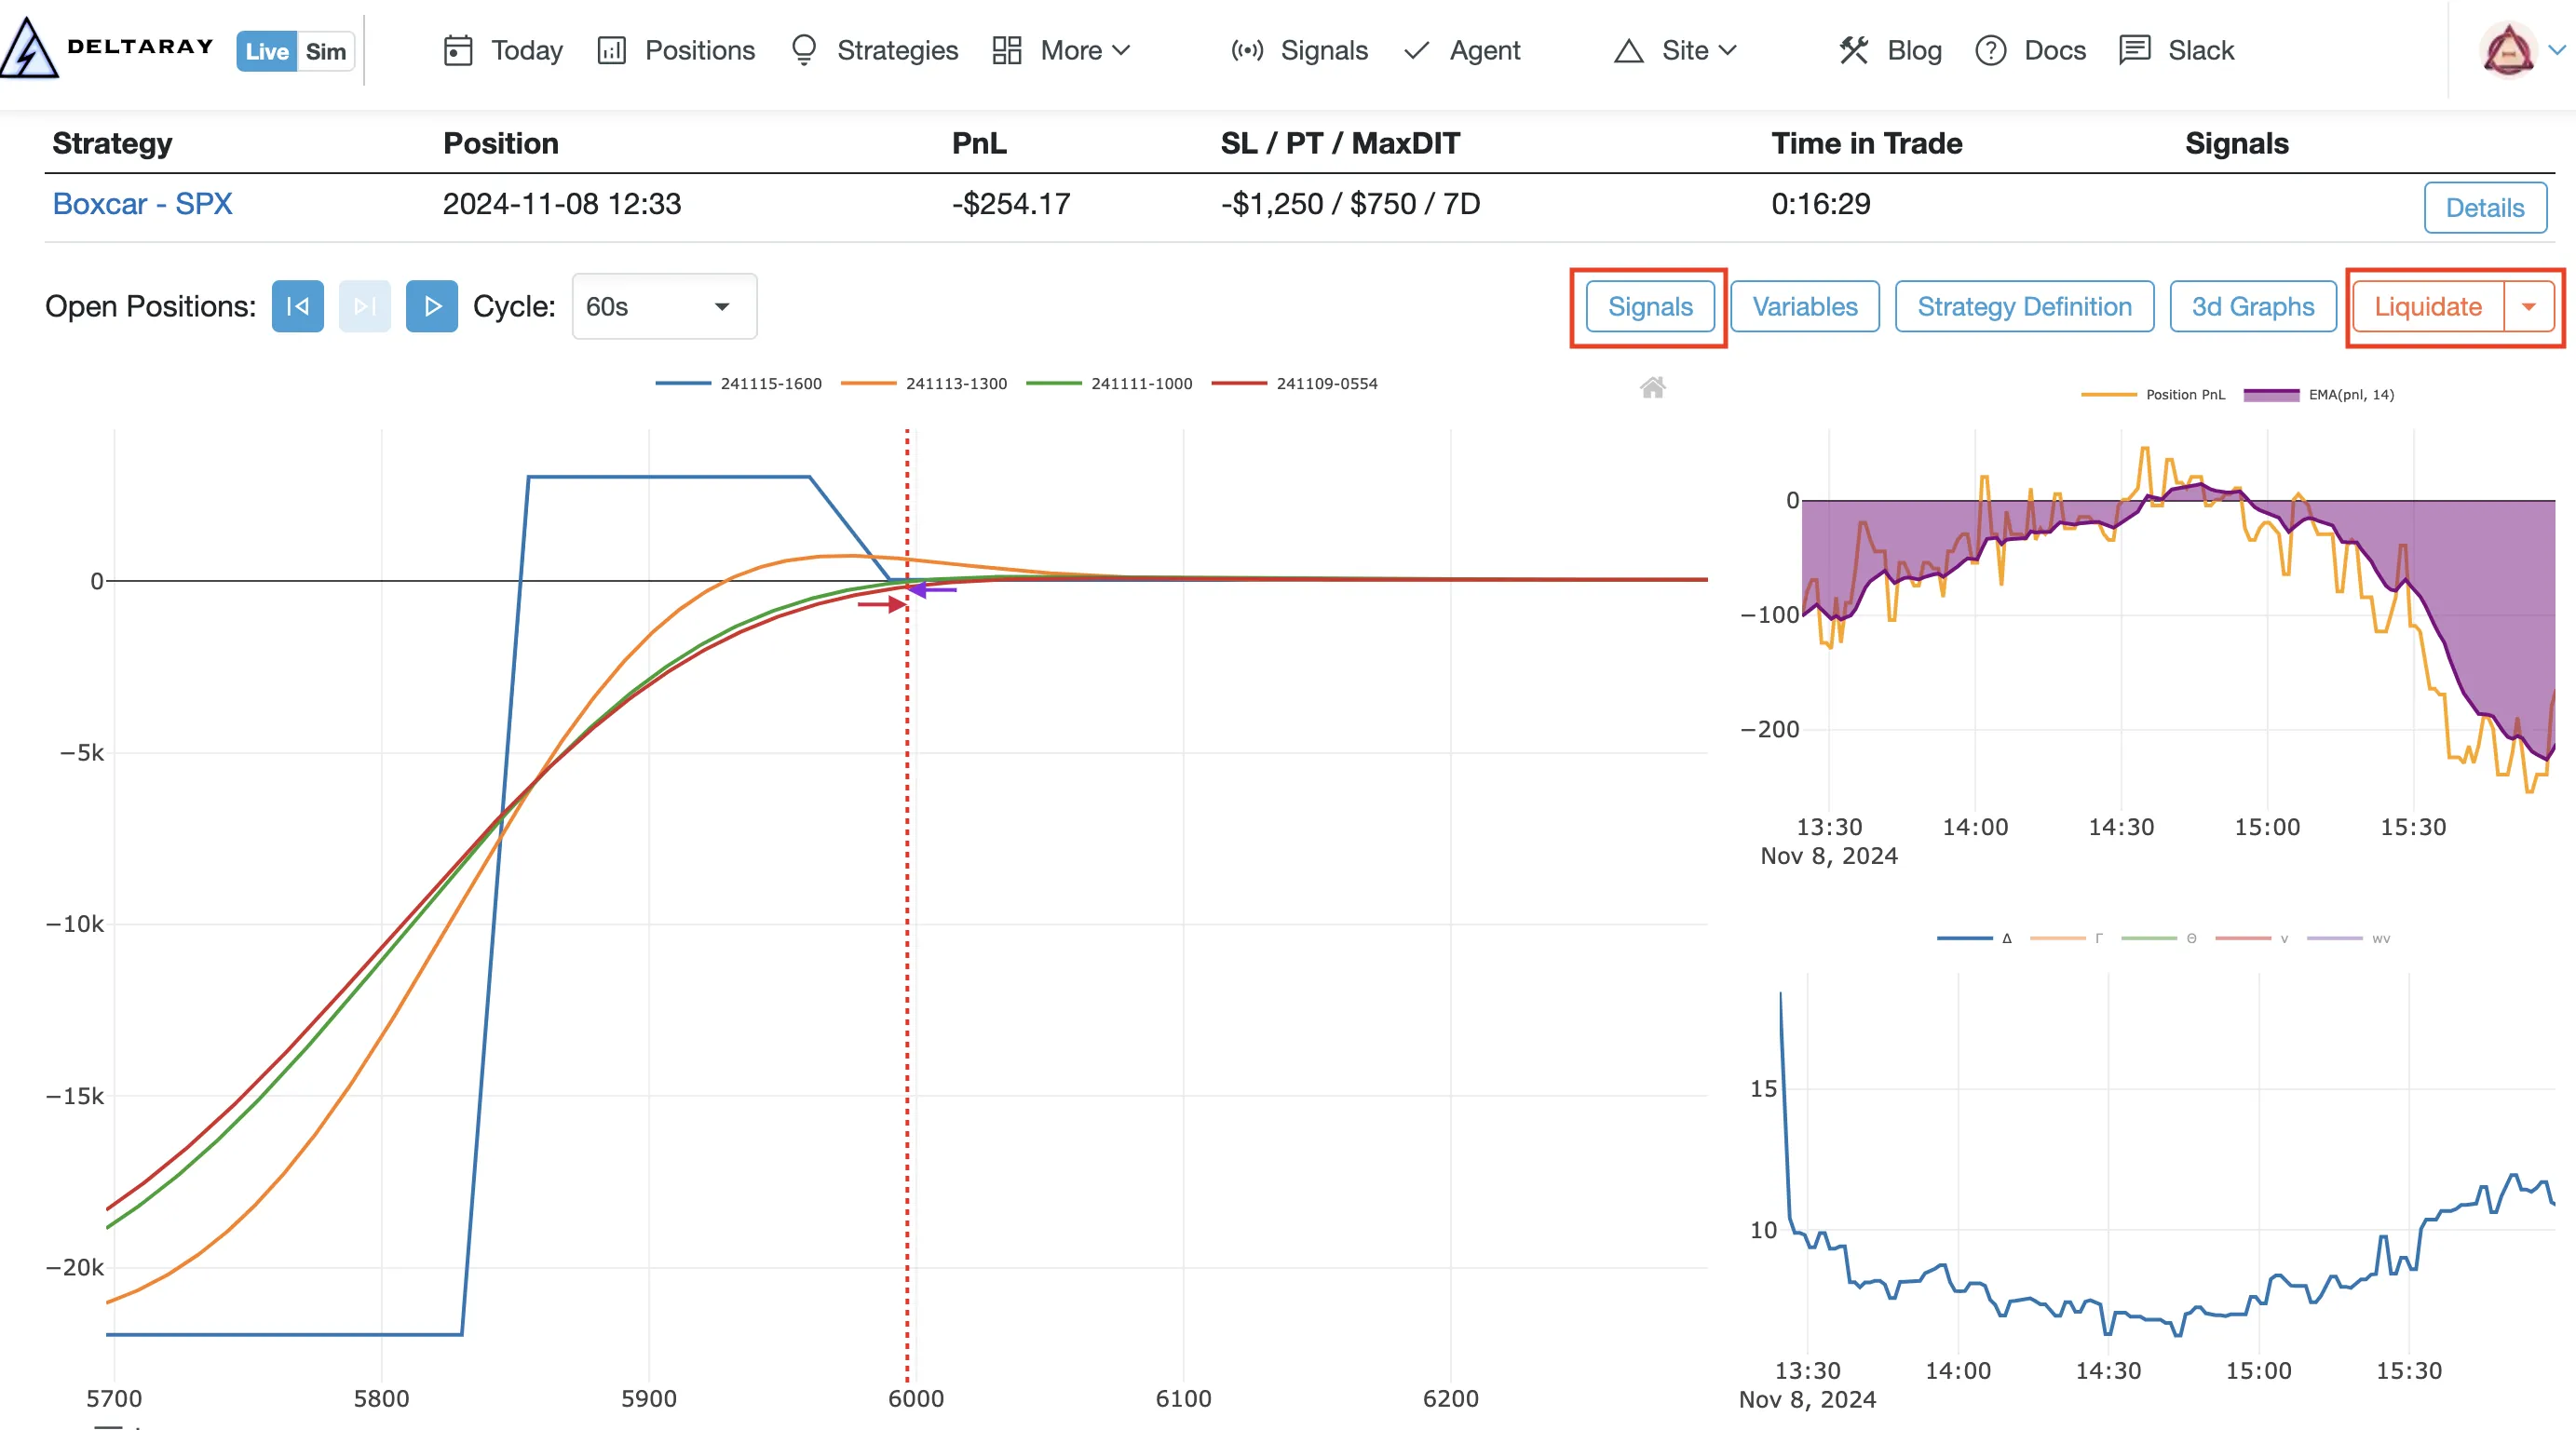
Key actions
- Signals: view exit/adjustment readiness and run adjustment flows: Signals
- Liquidate: exit the position: Position Liquidate
- Legs table: drill into executions and tracking corrections: Position Tracking → Legs
Data provider selector
If you have multiple connected providers (for example IBKR + TastyTrade), you can select which provider’s market data is used for risk graph rendering and greeks.
3D Graphs
The Position Details page provide 3D Graphs to inspect PnL and greeks across price/time scenarios. See: Risk Graphs → 3D Graphs.
Troubleshooting
- Risk graphs blank/stale: start with Troubleshooting → Agent, then inspect quotes in Data Explorer
- “Eval failed” in signals: see Troubleshooting → Signals
- Tracking/assignment issues: see Troubleshooting → Events and Position Tracking → Legs