Today View
Video tutorial
Steps
To access the Today view, click on the Today item in the navigation bar.
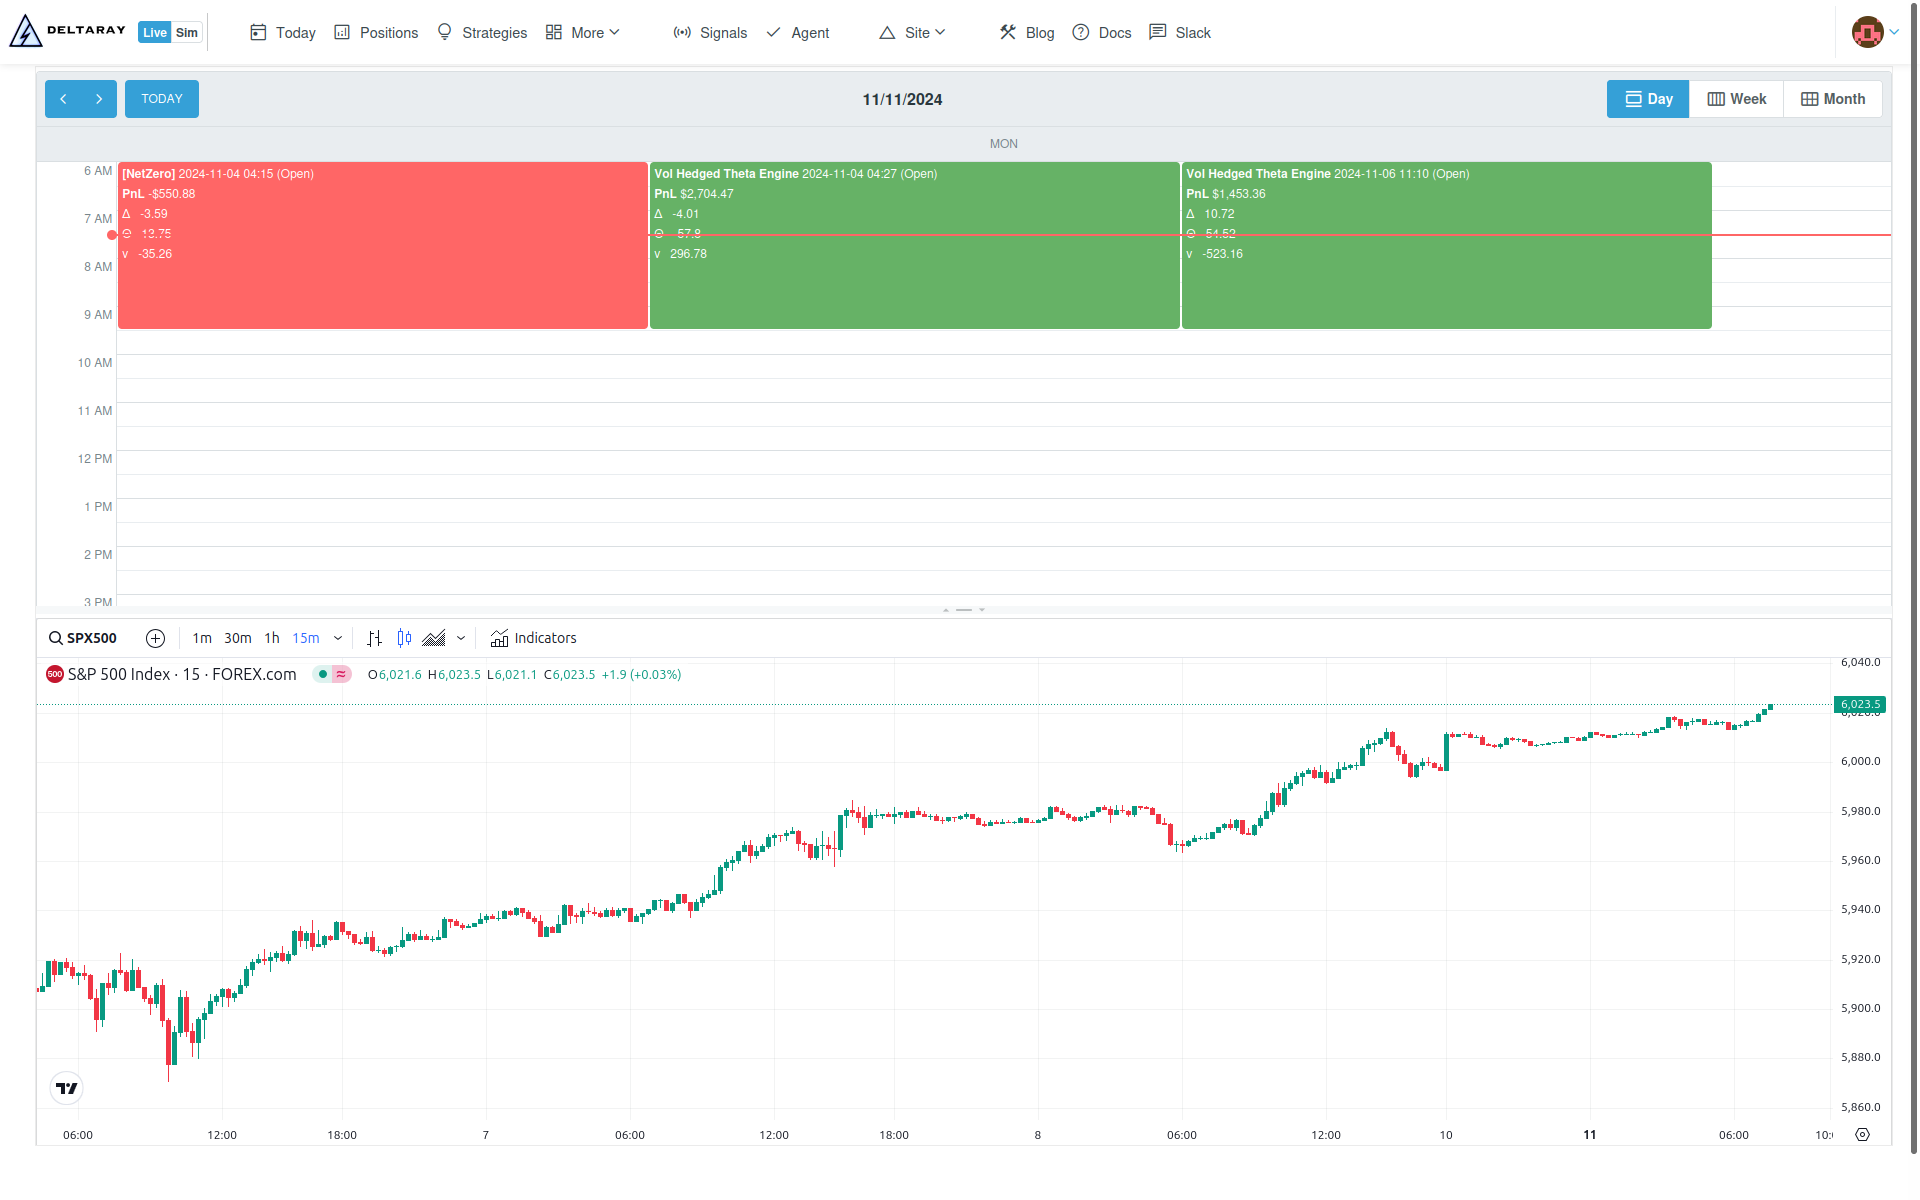
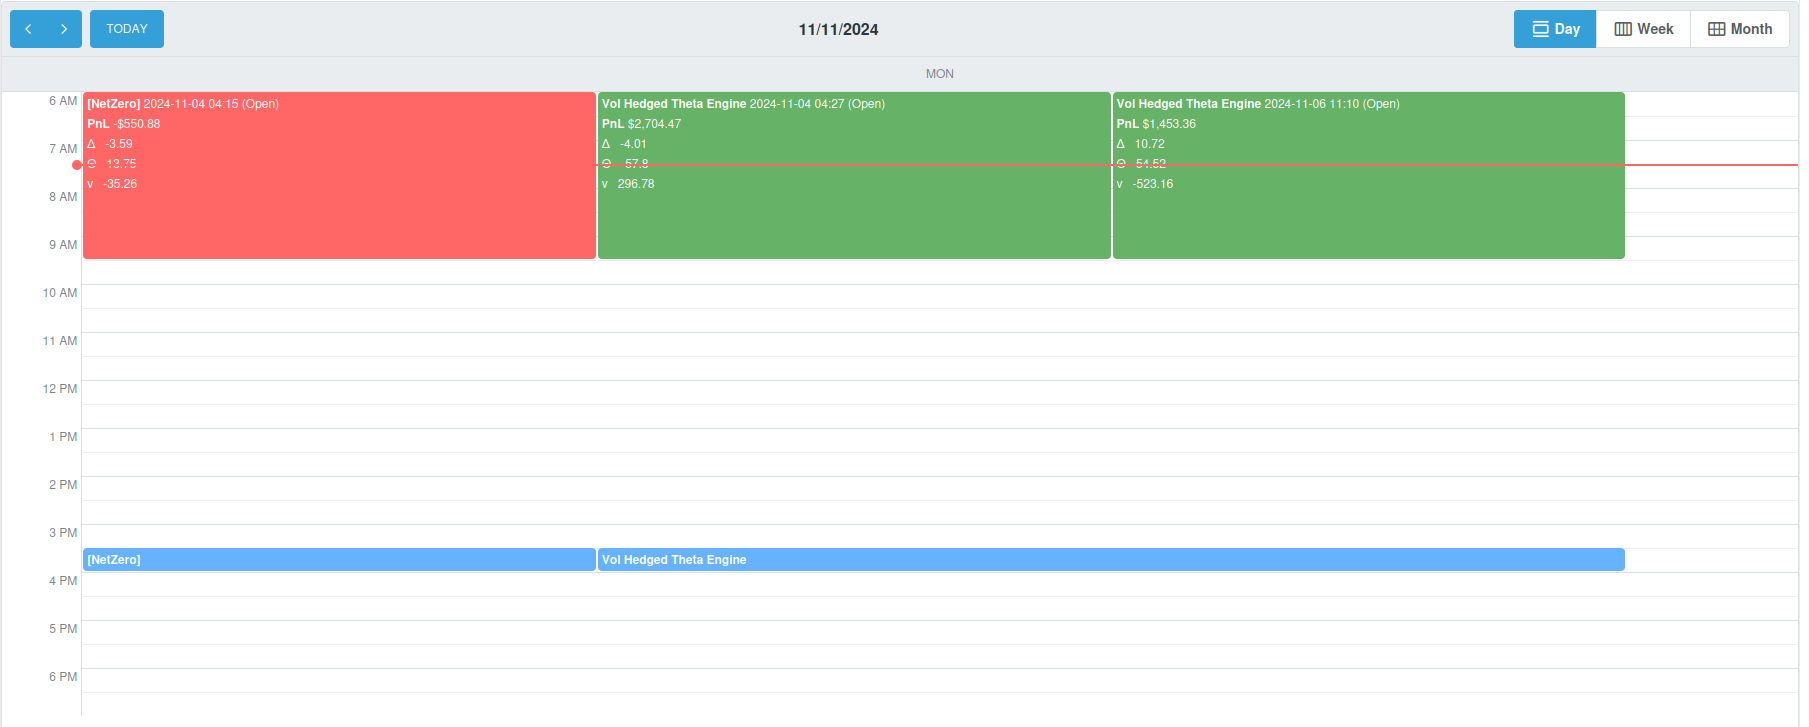
Calendar Display
The Calendar Display shows:
-
Currently Running Positions:
- Displayed in light colors based on position status:
- Profit: Light Green
- Loss: Light Red
- Displayed in light colors based on position status:
-
Closed Positions:
- Darker colors help differentiate closed positions:
- Closed in profit: Dark Green
- Closed in loss: Dark Red
- Darker colors help differentiate closed positions:
-
Future Strategies:
- Displayed in Blue to indicate positions scheduled to open in the future.
info
The red line on the calendar serves as a dynamic indicator of the current time, updating every 30 minutes to approximate the present moment within the daily schedule.
info
To open a strategy or position in another window, you can Ctrl + Click (Windows) or Command + Click (Mac) on the link. Ensure pop-ups are allowed in the browser settings for this feature to work.
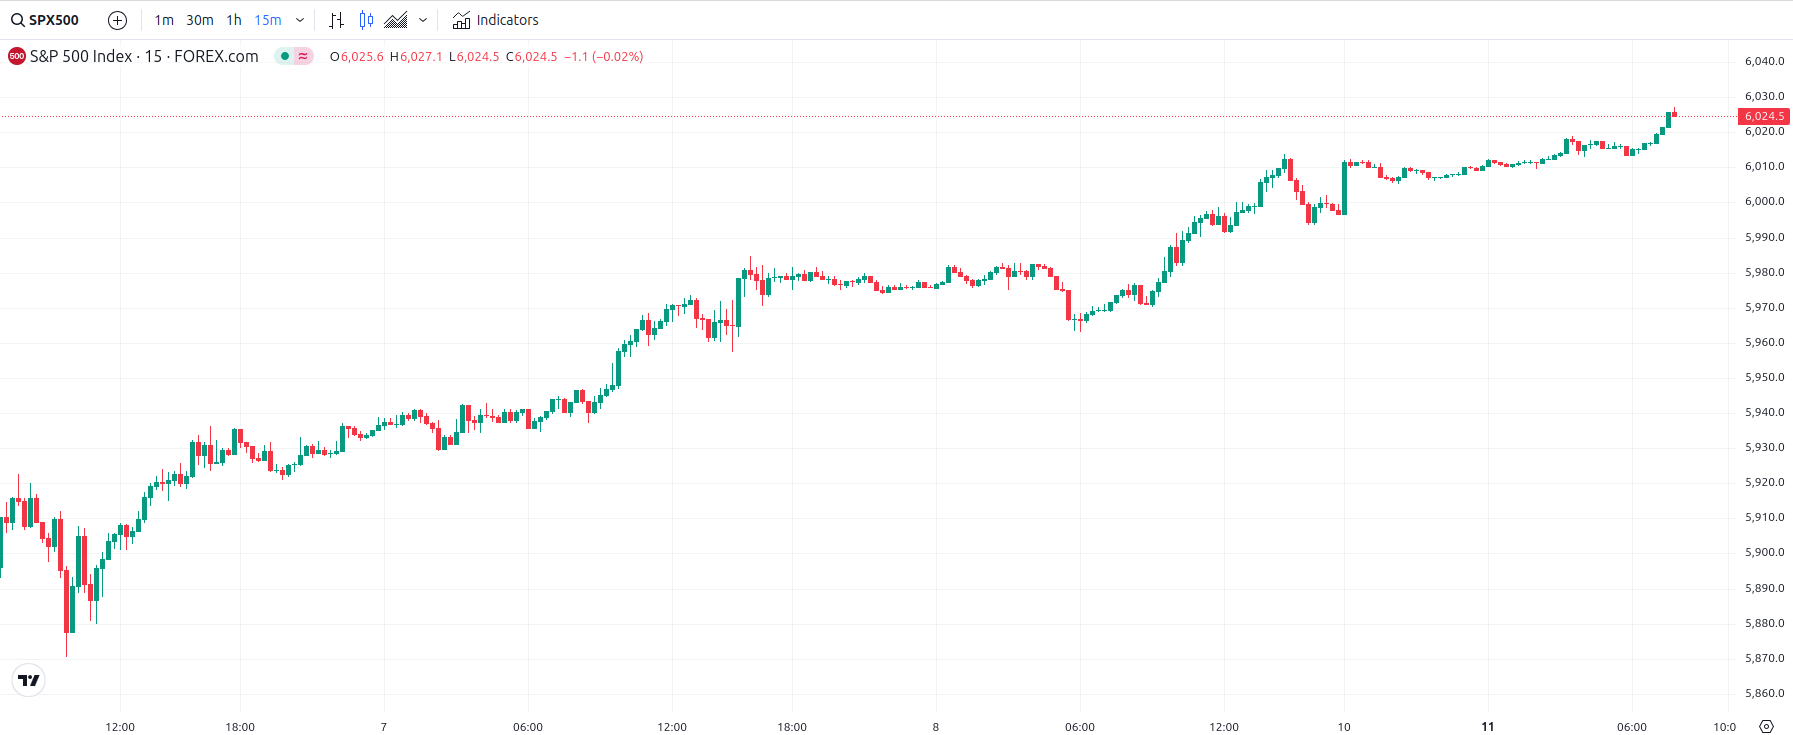
S&P 500 chart
Below the position calendar, you'll find a real-time S&P 500 chart. This chart provides live market updates, helping you make informed decisions for your positions.